Ein wenig Schnickschnack: »Matplotlib für Arme« in Trinket
Bevor ich mich – was schon seit einiger Zeit auf meiner Agenda steht – aufmache und herausfinde, wie GlowScript mit Trinket funktioniert, habe ich erst noch einmal eine Fingerübung erledigt, die ich auch schon lange ausprobieren wollte:
Ich wollte nämlich wissen, ob meine »Matplotlib für Arme«, die ich hier (Teil 1) und hier (Teil 2) schon einmal in Processing.py implementiert hatte, auch in Trinket läuft. Damals hatte ich meinen Abschied von TigerJython noch nicht vollzogen, also war die Implementierung in Processing.py mehr eine Spielerei. Nun aber denke ich, daß es notwendig ist, solch einen in Python programmierten (einfachen) Funktionsplotter auch für das Web zu haben. Und da bot sich Trinket einfach an.
Um es kurz zu machen: Der Port nach Trinket war recht einfach. Ich mußte nur berücksichtigen, daß die Processing-Bibliothek in Trinket aus irgendwelchen (nichtdokumentierten) Gründen ein noLoop() ablehnt und daß color() nur nach dem setup() aufgerufen werden kann. Das ist schade, weil dadurch eine globale Konstantenvereinbarung der verwendeten Farben (die ich gerne implementiert hätte) nur erschwert (eine unnütze Häufung von global-Vereinbarungen) möglich ist. Daher habe ich dies gelassen und die Farben hart codiert.
Hier der komplette Quelltext:
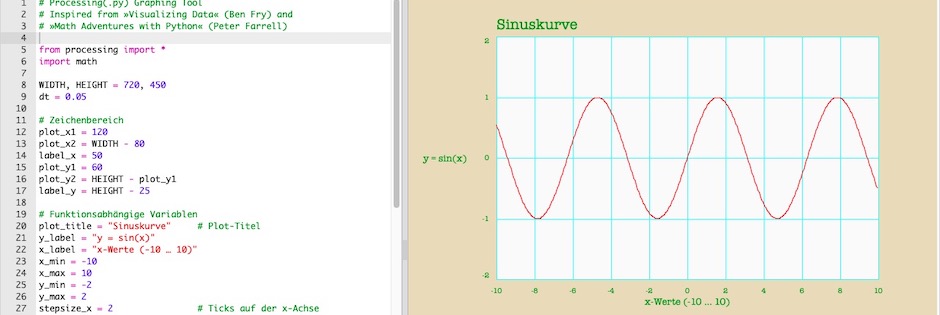
# Processing(.py) Graphing Tool
# Inspired from »Visualizing Data« (Ben Fry) and
# »Math Adventures with Python« (Peter Farrell)

from processing import *
import math

WIDTH, HEIGHT = 720, 450
dt = 0.05

# Zeichenbereich
plot_x1 = 120
plot_x2 = WIDTH - 80
label_x = 50
plot_y1 = 60
plot_y2 = HEIGHT - plot_y1
label_y = HEIGHT - 25

# Funktionsabhängige Variablen
plot_title = "Sinuskurve"     # Plot-Titel
y_label = "y = sin(x)"
x_label = "x-Werte (-10 … 10)"
x_min = -10
x_max = 10
y_min = -2
y_max = 2
stepsize_x = 2                # Ticks auf der x-Achse
stepsize_y = -1               # Ticks auf der y-Achse

# Zu zeichnende Funktion
def f(x):
  return(math.sin(x))

def setup():
  size(WIDTH, HEIGHT)
  print("Funktionsplotter: " + plot_title)
  plot_font = createFont("American Typewriter", 20)
  textFont(plot_font)
  background(234, 218, 184)

  # Den Plot in einem Kasten zeichnen
  fill(250, 250, 250)
  rectMode(CORNERS)
  noStroke()
  rect(plot_x1, plot_y1, plot_x2, plot_y2)

  # Titel des Plots zeichnen
  fill(0, 150, 0)
  textSize(20)
  textAlign(LEFT, BASELINE)
  text(plot_title, plot_x1, plot_y1 - 10)

  # Plot zeichnen
  draw_grid()
  draw_axis_labels()
  draw_function()

  print("I did it, Babe!")

def draw_grid():
  # Zeichne Gitter und Label
  textSize(10)
  textAlign(CENTER, TOP)
  # x-Achse
  for i in range(x_min, x_max + 1, stepsize_x):
    x = map(i, x_min, x_max, plot_x1, plot_x2)
    fill(0, 150, 0)
    text(str(i), x, plot_y2 + 10)
    strokeWeight(1)
    stroke(0, 250, 250)
    line(x, plot_y1, x, plot_y2)
  # y-Achse
  for j in range(y_max, y_min - 1, stepsize_y):
    y = map(j, y_max, y_min, plot_y1, plot_y2)
    if j == y_min:         # Korrektur unterste Zeile
      textAlign(RIGHT, BOTTOM)
    elif j == y_max:       # Korrektur oberste Zeile
      textAlign(RIGHT, TOP)
    else:                  # Vertikal zentrieren
      textAlign(RIGHT, CENTER)
    fill(0, 150, 0)
    text(str(j), plot_x1 - 10, y)
    strokeWeight(1)
    stroke(0, 250, 250)
    line(plot_x1, y, plot_x2, y)

def draw_axis_labels():
  fill(0, 150, 0)
  textSize(13)
  textLeading(15)
  textAlign(CENTER, CENTER)
  text(y_label, label_x, (plot_y1 + plot_y2)//2)
  textAlign(CENTER,  BASELINE)
  text(x_label, (plot_x1 + plot_x2)//2, label_y)

def draw_function():
  stroke(250, 10, 10)
  x = x_min
  while x <= x_max - dt:
    x_0 = map(x, x_min, x_max, plot_x1, plot_x2)
    x_1 = map(x + dt, x_min, x_max, plot_x1, plot_x2)
    y_0 = map(f(x), y_min, y_max, plot_y2, plot_y1)
    y_1 = map(f(x + dt), y_min, y_max, plot_y2, plot_y1)
    line(x_0, y_0, x_1, y_1)
    x += dt

run()
Für andere, eigene Funtionen müssen »nur« die funktionsabhängigen Variablen und die zu zeichnende Funktion f(x) angepaßt werden. Ich habe dies in einem Codeblock (Zeilen 19 bis 32) zusammengefaßt. Alles andere kann so bleiben, wie es ist.
Der Quelltext ist nicht nur wie gewohnt auf GitHub zu finden, sondern Ihr könnt das Trinket auch remixen und an Eure Bedrürfnisse anpassen. Macht damit also, was Ihr wollt und habt Spaß.