FPlotter: Meine »Matplotlib für Arme« nach Py5 portiert
Um meine gestern begonnenen Experimente weiterführen zu können, habe ich heute erst einmal das Skript FPlotter (2), meine »Matplotlib für Arme«, von Processing.py nach Py5 portiert.
Im großen und ganzen war der Port straight forward, lediglich bei der von mir beinahe inflationär verwendeten map()-Funktion von Processing mußte ich berücksichtigen, daß diese – damit sie nicht in Konflikt mit der gleichnamigen Python-Funktion gerät – in Py5 in remap() umbenannt wurde.
Außerdem habe ich schon Slots vorbereitet, die es zum einen ermöglichen sollen, mehr als eine Funktion zu zeichnen und zum anderen, die zu zeichnenden Funktionswerte aus einer Liste (oder mehrere Listen) lesen zu können. Doch dies werde ich ein einer zweiten Version dieses Skriptes realisieren, die ich in den nächsten Tagen fertig- und vorstellen möchte.
Doch hier erst einmal den Quellcode der ersten Fassung dieses Skriptes in Py5, damit Ihr das Modul nachvollziehen und mit Euren eigenen Ideen erweitern könnt:
# Funkrionsplotter in Py5
# Inspired from »Visualizing Data« (Ben Fry) and
# »Math Adventures with Python« (Peter Farrell)
import math
WIN_WIDTH, WIN_HEIGHT = 740, 480
# Zeichenfenster
plot_x1 = 120 # Start Fensterbreite rechts
plot_x2 = WIN_WIDTH - 80 # Ende Fensterbreite links
label_x = 50
plot_y1 = 60 # Start Fensterhöhe oben
plot_y2 = WIN_HEIGHT - plot_y1 # Ende Fensterhöhe unten
label_y = WIN_HEIGHT - 25
# Schrittweite
dt = 0.05
# Titel
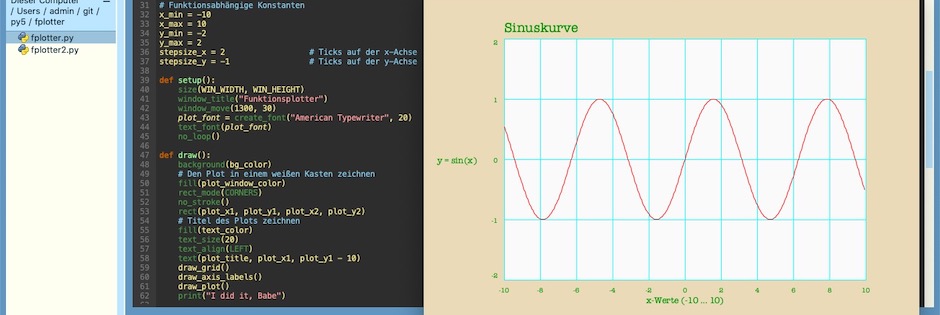
plot_title = "Sinuskurve"
# Farben
bg_color = color(234, 218, 184) # Packpapier
text_color = color(0, 150, 0) # Grün
plot_window_color = color(250, 250, 250) # Weiß
grid_color = color(0, 250, 250) # Blau-Grau
line_color_1 = color(250, 0, 0) # Rot
line_color_2 = color(0, 0, 250) # Blau
# Funktionsabhängige Konstanten
x_min = -10
x_max = 10
y_min = -2
y_max = 2
stepsize_x = 2 # Ticks auf der x-Achse
stepsize_y = -1 # Ticks auf der y-Achse
def setup():
size(WIN_WIDTH, WIN_HEIGHT)
window_title("Funktionsplotter")
window_move(1300, 30)
plot_font = create_font("American Typewriter", 20)
text_font(plot_font)
no_loop()
def draw():
background(bg_color)
# Den Plot in einem weißen Kasten zeichnen
fill(plot_window_color)
rect_mode(CORNERS)
no_stroke()
rect(plot_x1, plot_y1, plot_x2, plot_y2)
# Titel des Plots zeichnen
fill(text_color)
text_size(20)
text_align(LEFT)
text(plot_title, plot_x1, plot_y1 - 10)
draw_grid()
draw_axis_labels()
draw_plot()
print("I did it, Babe")
def f(x):
return(math.sin(x))
def draw_plot():
stroke(line_color_1)
x = x_min
while x <= x_max - dt:
x_0 = remap(x, x_min, x_max, plot_x1, plot_x2)
x_1 = remap(x + dt, x_min, x_max, plot_x1, plot_x2)
y_0 = remap(f(x), y_min, y_max, plot_y2, plot_y1)
y_1 = remap(f(x + dt), y_min, y_max, plot_y2, plot_y1)
line(x_0, y_0, x_1, y_1)
x += dt
def draw_grid():
# Zeichne Gitter und Label
text_size(10)
text_align(CENTER, TOP)
# x_Achse
for i in range(x_min, x_max + 1, stepsize_x):
x = remap(i, x_min, x_max, plot_x1, plot_x2)
fill(text_color)
text(str(i), x, plot_y2 + 10)
stroke_weight(1)
stroke(grid_color)
line(x, plot_y1, x, plot_y2)
# y-Achse
for j in range(y_max, y_min - 1, stepsize_y):
y = remap(j, y_max, y_min, plot_y1, plot_y2)
if j == y_min:
text_align(RIGHT, BOTTOM) # Unten
elif j == y_max:
text_align(RIGHT, TOP) # Open
else:
text_align(RIGHT, CENTER) # Vertikal zentrieren
fill(text_color)
text(str(j), plot_x1 - 10, y)
stroke_weight(1)
stroke(grid_color)
line(plot_x1, y, plot_x2, y)
def draw_axis_labels():
fill(text_color)
text_size(13)
text_leading(15)
text_align(CENTER, CENTER)
text("y = sin(x)", label_x, (plot_y1 + plot_y2)//2)
text_align(CENTER)
text("x-Werte (-10 … 10)", (plot_x1 + plot_x2)//2, label_y)Natürlich gibt es den Quellcode auch in meinem GitHub-Repositorium.
Für die weitere Entwicklung wäre es schön, wenn man die Simulation und den (oder die) zu zeichnenden Graphen entweder in separaten Fenstern oder in verschiedenen Tabs1 laufen lassen könnte. Hier sollte ich mal nachschauen, ob und wie weit es mittlerweile möglich ist, PySimpleGUI mit Py5 zu verkuppeln2. Still digging!
Literatur
Fogende beiden Werke hatten mich auf die Idee zu dem Funktionsplotter in Processing.py und Py5 gebracht und zu meiner eigenen Version inspiriert:
- Ben Fry: Visualizing Data – Exploring and Explaining Data with the Processing Environment, Sebastopol (O’Reilly) 2008, Seiten 54ff.
- Peter Farrell: Math Adventures with Python. An Illustrated Guide to Exploring Math with Code, San Francisco (No Starch Press) 2019, Seiten 61ff.
Fußnoten
In Visualizing Data (eines der Inspirationsquellen für den FPlotter) pp. 83 ff zeigt BenFry, wie man mehrere Tab-Panele in Processing realisiert. Sollte ich mir daher noch einmal genauer anschauen.↩︎
Es gab vor etwa einem Jahr erste, erfolgreiche Versuche von Alexandre B A Villares, für die aber noch einige seltsame Hürden berücksichtigt werden mußten.↩︎